How to Track Egg Production (and Actually Use the Data)
A practical system for tracking egg production: lay percentage, eggs per bird, seasonal dips, and what the numbers tell you about feed, light, and flock health.
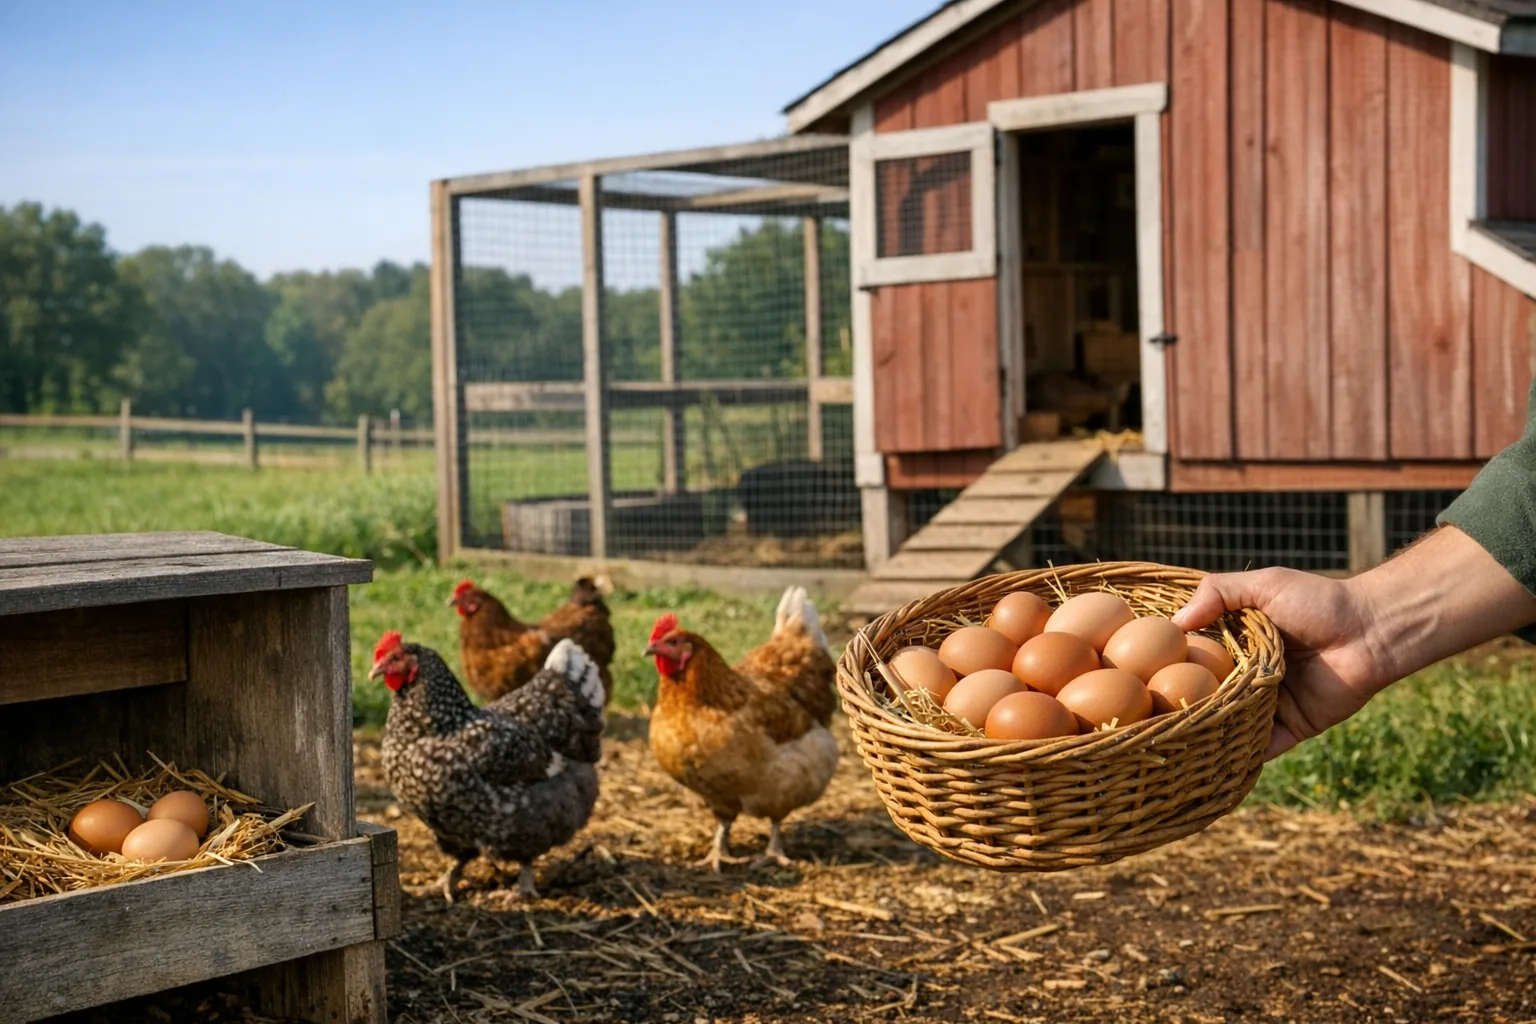
Most people who keep laying hens track egg production the same way: a number scratched on a calendar, or nothing at all. That works fine right up until the morning you walk out to the coop, collect four eggs instead of fourteen, and have no idea whether something is wrong or whether it’s just Tuesday.
The point of tracking isn’t to generate a spreadsheet you’ll never look at. It’s to know your flock well enough that a problem shows up as a line on a chart before it shows up as a sick bird or an empty nesting box. Here’s a system that takes about thirty seconds a day and actually earns its keep.
The One Number That Matters: Lay Percentage
Total egg count is satisfying to write down, but it’s misleading on its own. Twelve eggs from twelve hens is a great day. Twelve eggs from twenty-five hens is a flock with a problem. The number that lets you compare today to last month — and your flock to a healthy benchmark — is lay percentage.
The math is simple:
Lay % = (eggs collected ÷ number of laying-age hens) × 100
If 18 hens give you 15 eggs, that’s 83%. If they give you 9, that’s 50%, and now you have a question worth asking. Lay percentage normalizes for flock size, so when you add four pullets in August or lose two hens to a hawk, your trend line still means something.
A few benchmarks to anchor yourself:
- Peak (spring, first laying year): 80–90% is excellent. Production breeds can brush 95% for short stretches.
- Annual average: 50–70% is realistic and healthy once you average in molt, winter, and broody hens.
- Second year: expect roughly 10–20% lower peak than year one, with bigger eggs.
- Below 40% with no obvious cause: worth investigating — light, feed, parasites, or hidden nests.
Record the daily count, but watch the weekly average of the percentage. Daily numbers bounce around for reasons that don’t matter (a hen skipped a day, you collected late). The seven-day average is where the signal lives.
What Eggs-Per-Bird Tells You Over a Season
Lay percentage is your daily and weekly metric. Eggs per bird is your seasonal one. Take total eggs over a month or a season, divide by your hen count, and you get a cumulative figure you can compare year over year.
This is the number that answers business-adjacent questions, even for a homestead flock:
- Is the new feed actually improving output, or did production just rise because the days got longer?
- Are my heritage Wyandottes pulling their weight against the Leghorns, or are they costing me feed for half the eggs?
- Did adding the run extension and reducing crowding move the needle?
A laying hen eats roughly a quarter-pound of feed a day whether she lays or not. Eggs per bird, set against your feed cost, is what turns “the chickens” from a vague expense into a line you can actually manage. If you’re selling eggs, it’s the difference between guessing your cost per dozen and knowing it — the exact gap we dig into in is raising chickens profitable.
Reading the Seasonal Dip (Before You Panic)
The single most common “my hens stopped laying” emergency is just the calendar doing its job. Hens are photoperiod-driven: they need about 14–16 hours of light to lay at full tilt, and production tapers off below roughly 12 hours. That means most flocks slow in fall, bottom out near the winter solstice, and surge again in spring — completely normal, completely predictable.
The other big seasonal driver is the annual molt. Once a year, usually in fall, hens drop and regrow feathers, and laying nearly stops while their bodies divert protein to feather production. A molting hen looks alarming — patchy, scruffy, pin-feathers everywhere — but she’s fine. Molt typically runs 8–12 weeks. If you’ve been tracking, you’ll see the dip start, recognize the pattern from last year, and not waste a vet call on it.
Here’s where records pay off. When the drop is seasonal, your chart shows a gentle, predictable slope that lines up with shortening days or the molt window. When the drop is a problem — a predator scare, a feed mistake, mites, a respiratory bug — it shows up as a sharp cliff on a specific date. Same symptom (fewer eggs), completely different shape on the chart. Without records, both just feel like “the hens stopped laying.” With them, you know which one you’re dealing with within a day.
A Thirty-Second Daily System
The best tracking system is the one you’ll actually do every single day, because a record with gaps is nearly worthless for spotting trends. Keep it brutally simple:
- Collect and count. One number: today’s egg total.
- Note anything unusual. Three words max — “added 4 pullets,” “first frost,” “switched feed,” “hawk in run.” These annotations are what let you explain a dip three weeks later.
- Log it somewhere with a running total. This is the step that fails. A clipboard by the coop captures the count but rarely gets transferred, so you never see the trend. A notes app captures it but won’t chart it. The whole value is in seeing the line.
Things worth logging beyond the daily count, when they happen:
- Feed type and protein percentage (layer feed should be ~16–18% protein)
- Supplemental light schedule, if you run one
- Hens added or removed, with the date
- Health events, treatments, and predator incidents
- Weather extremes — a 95°F week or a hard cold snap explains a lot
From Notebook to a System That Charts Itself
A coop clipboard is a fine place to start. It’s a poor place to stay, because the data never compounds into insight — every page is just a column of numbers, and nobody flips back six months to graph it by hand.
This is exactly the gap FarmsFlo is built to close. You log the daily count once and the platform handles the rest: lay percentage calculated automatically against your current hen count, the weekly and seasonal trend charted so a real dip jumps off the screen, and your flock changes, feed notes, and health events sitting right alongside the numbers so a drop always has context. If you keep ducks, meat birds, or other livestock too, they live in the same records instead of three different notebooks — the same one-system idea behind a homestead record-keeping system that replaces your binder. The Free tier is enough to track a backyard flock; Pro and Complete add the inventory, sales, and CSA tools if your eggs start paying for themselves.
The chickens will lay whether you write it down or not. Tracking is how you stop being surprised by your own flock — and start making feed, light, and culling decisions on numbers instead of vibes.
Insider P.S. — if you run a flock and a few farming friends, you can also earn $10–$25/mo recommending FarmsFlo through the Insider program. It’s a recurring referral payout, not a one-time kickback.