5 Tested Ways Crop Management Software Actually Transforms Farm Operations by 2026
Five tested crop-management software moves for 2026: tighter field plans, cleaner labor hours, less input waste, and one record the crew actually uses.
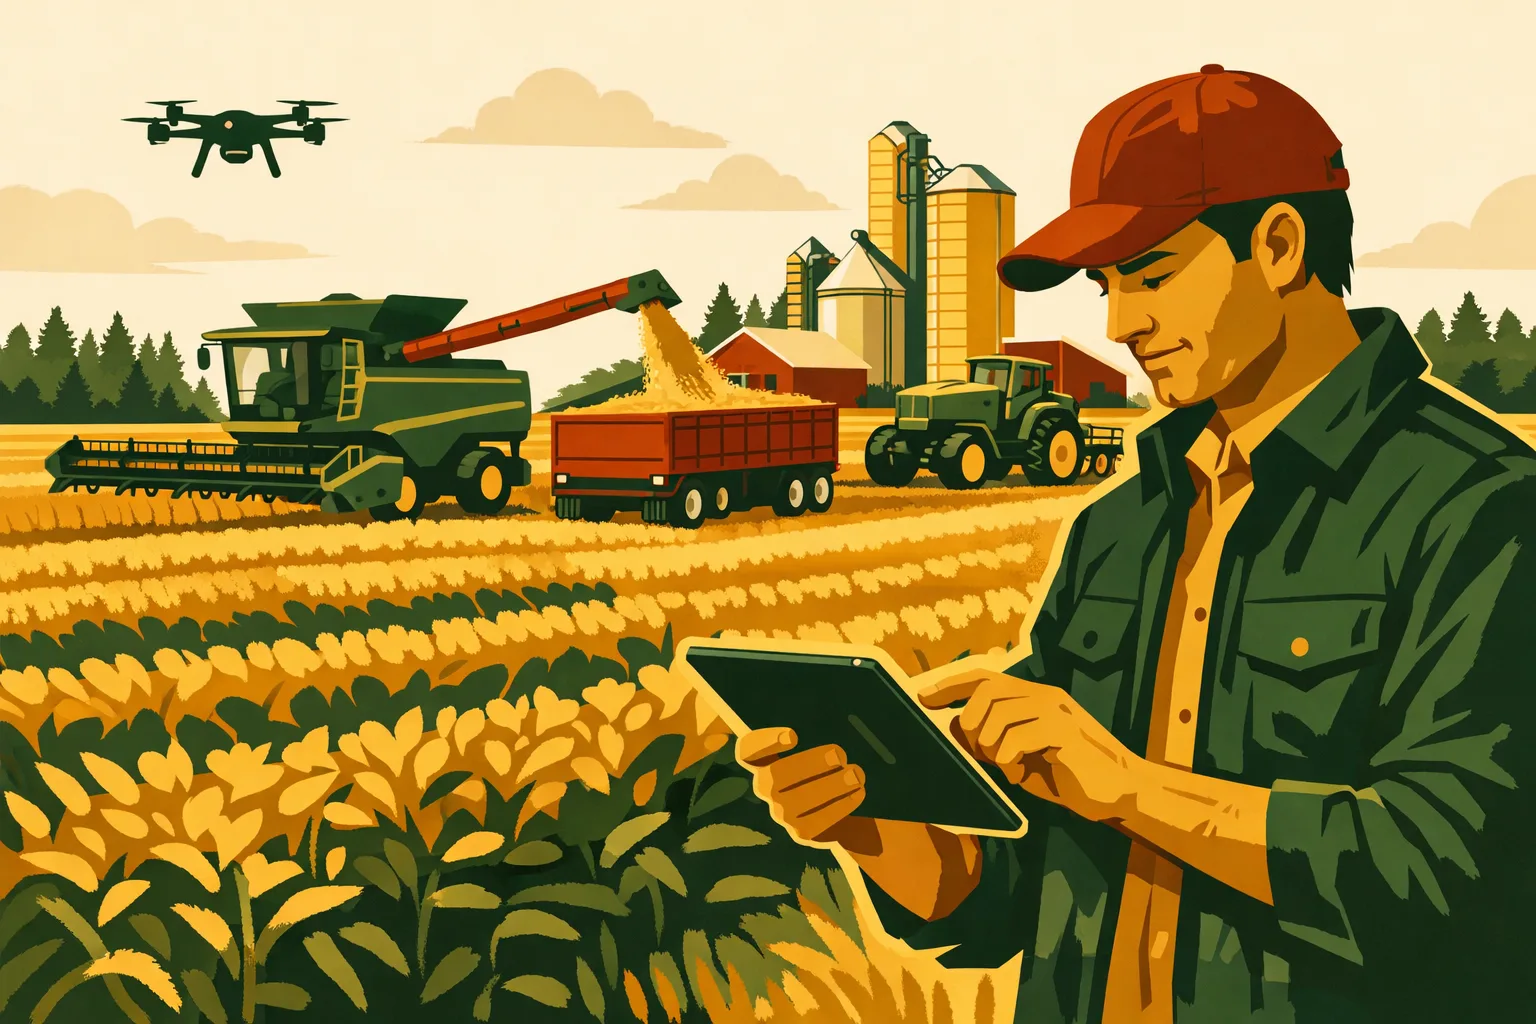
A 1,400-acre corn and soybean operation in central Illinois spent three seasons running variable-rate nitrogen off spreadsheets, a shared Dropbox folder, and the agronomist’s memory. The prescriptions worked. The record-keeping didn’t. When the operator went to sell into a low-carbon-intensity ethanol contract, he couldn’t produce field-level application records that satisfied the verifier’s audit trail. He left roughly $40,000 in premium on the table — not because his agronomy was wrong, but because his documentation lived in seven places and none of them talked to each other.
That gap between what farms do and what farms can prove is where crop management software earns its keep. Not in the dashboards. Not in the satellite imagery that looks impressive at a winter meeting. In the boring, compounding work of turning field activity into structured data you can query, audit, and act on.
Below are five specific transformations that hold up under scrutiny, with the operational detail and cost realities that most vendor pitches skip.
What Crop Management Software Actually Does (and What It Doesn’t)
Before the five use cases, some definitional cleanup. “Crop management software” gets applied to at least four distinct product categories, and buying the wrong one is the most common and expensive mistake in ag tech procurement.
The Four Product Categories
Field record-keeping and agronomic platforms. Core function: store field boundaries, log every input application, planting event, scouting note, and harvest result against a geospatial record. Examples of this category include Climate FieldView, Granular, AgriWebb (livestock-leaning), and a long tail of regional players. This is the foundation layer.
Farm business management systems (FBMS). These extend record-keeping into cost accounting, enterprise budgeting, inventory, labor, and equipment. They answer “what did this field cost me per bushel” rather than just “what did I apply.”
Precision ag execution platforms. Prescription writing, as-applied verification, machine data ingestion from ISOBUS and proprietary telematics, RTK correction management. These live closest to the iron.
Compliance and traceability layers. Purpose-built for GlobalG.A.P., FSMA Produce Safety Rule, organic certification, or carbon-intensity scoring. Often bolt onto one of the above.
Most 500–5,000 acre row crop operations need categories one and two tightly integrated, with an import path from category three. Specialty and fresh produce operations usually cannot avoid category four.
What It Won’t Fix
Software does not fix a farm without defined processes. If your spray records currently depend on one person’s willingness to write things down, a mobile app changes the medium, not the behavior. Implementations fail on adoption far more often than on functionality — expect to spend more effort on operator training and accountability than on configuration.
It also won’t fix bad boundaries. Roughly every implementation consultant will tell you the same thing: the first two weeks are spent cleaning field boundaries that are off by three to fifteen acres because they were traced from a 2013 satellite image or inherited from an FSA map that never matched reality.
Transformation 1: Input Cost Visibility at the Field and Sub-Field Level
Most operations know their total fertilizer spend to the dollar. Far fewer can tell you, without a two-hour spreadsheet session, what nitrogen cost per bushel on their worst-performing 80 acres versus their best.
The Mechanism
When every application event is logged against a georeferenced field with product, rate, date, applicator, and cost, you get a per-acre input cost that rolls up by field, by farm, by landlord, by crop, and by enterprise. Layer harvest yield data on top and you have cost per bushel at whatever resolution your yield monitor delivers.
That single number reframes decisions. A field averaging 210 bu/ac corn at $340/acre in inputs is a different business than a field averaging 178 bu/ac at $335/acre in inputs. The second one is where cash rent renegotiations, drainage capital, or a crop switch belong on the agenda.
What Operators Actually Find
Three patterns show up consistently in first-year analysis:
Rate creep on the margins. Blanket rates applied to headlands, waterways, and end rows that produce well below field average. On a 2,000-acre operation with typical field geometry, non-productive and low-productivity acres routinely account for 3–6% of applied inputs. At $300/acre in inputs, that’s $18,000–$36,000 annually in spend on acres that won’t return it.
Duplicate applications. Overlap at field boundaries between two applicators, or a re-treatment logged by a custom operator that the farm also applied. Small individually. Real in aggregate.
Product mix inefficiency. Buying three fungicides with overlapping modes of action across different fields because purchasing decisions happened at three different times with three different reps.
Implementation Reality
Getting to reliable per-field costing requires cost data entry discipline, not just application logging. Invoice reconciliation is the choke point. Budget 4–6 hours per month for someone to match delivered product invoices against logged applications until the workflow stabilizes — typically two to three months.
A practical shortcut: enter standing product costs at the start of the season and reconcile actual invoice variance quarterly rather than per-load. You lose some precision and gain a workflow people will actually maintain.
Transformation 2: Compliance Documentation That Survives an Audit
This is where the ROI is least theoretical and most immediate, particularly for operations selling into regulated or premium channels.
The Documentation Burden by Market Channel
| Market Channel | Primary Documentation Requirement | Typical Audit Frequency | Manual Hours/Year (1,000 ac) | Software-Assisted Hours/Year |
|---|---|---|---|---|
| Commodity row crop (no premium) | State pesticide records, RUP applicator logs | Spot inspection | 20–40 | 8–15 |
| Low-CI ethanol / carbon programs | Field-level practice verification, tillage and N records, 3+ yr history | Annual, third-party verified | 60–120 | 20–35 |
| Organic certification | Full input traceability, buffer records, seed sourcing, harvest segregation | Annual, on-site | 100–180 | 40–70 |
| GlobalG.A.P. / fresh produce | Water testing, worker hygiene, harvest traceability to lot, MRL intervals | Annual, unannounced possible | 150–300 | 60–110 |
| Sustainability-linked contracts (grain buyers) | Practice attestation, sometimes remote-sensed verification | Annual | 30–60 | 10–20 |
The hour figures above are ranges from operator-reported implementation experience and will vary substantially with existing record quality. The pattern holds regardless: documented, structured records cut audit preparation by roughly half to two-thirds.
Pre-Harvest Interval and Re-Entry Interval Enforcement
For specialty crops, this is arguably the single highest-value software function. A system that knows what was applied to which block on which date, and cross-references the label PHI, can block a harvest order or flag a conflict before the crew is in the field. Manual PHI tracking on a diversified vegetable operation running 40 blocks and 15 crops is a genuine liability exposure — one mistake produces a rejected load, a positive residue test, or worse.
Restricted Use Pesticide Records
Federal RUP recordkeeping requirements are unambiguous about what must be retained and for how long (two years federally, longer in many states). The elements: product name, EPA registration number, total amount applied, size of area treated, location, crop, date, applicator name and certification number. Software that captures these as required fields at the point of application, rather than reconstructing them in February, eliminates the most common inspection finding.
Transformation 3: Labor Coordination and Task Accountability
The larger the operation, the more value shifts from agronomy to logistics. At 3,000+ acres with seasonal crews, the constraint is rarely knowing what to do — it’s getting the right person to the right field with the right equipment before the weather window closes.
Work Order Workflows
The functional pattern that works:
- Manager creates a task with field, operation type, product/rate, and equipment assignment
- Task pushes to the operator’s mobile device with field boundary and navigation
- Operator marks start, records actual conditions (wind speed, temp, humidity for spray records), completes, and notes acres covered
- Completion writes back to the field record automatically
- Exceptions — skipped acres, product substitutions, breakdowns — get flagged for manager review
Step 3 is where most implementations fail. Operators will not fill out an eleven-field form on a phone while sitting in a cab with a running clock. Configure the minimum viable field set, use defaults aggressively, and pull what you can from equipment telemetry.
Measurable Coordination Gains
Operations that get work order discipline right typically report:
- Reduced re-work from miscommunication. The “I thought you said the north 80” problem largely disappears when the task carries a boundary.
- Faster payroll close. Hours tied to tasks and fields rather than reconstructed from timesheets. Operations running 8–20 seasonal employees commonly cut payroll processing from a full day to two hours.
- Custom application billing accuracy. If you do custom work, per-acre invoicing straight from completed task records ends the disputes.
The Adoption Problem, Concretely
Assume 30–50% of your operators will resist mobile data entry initially. The interventions that work, ranked by effectiveness:
- Tie a specific benefit to their use — accurate hours, accurate acre-based pay, fewer callbacks to re-do work
- Make the manager’s own workflow depend on it, so incomplete entries create visible friction
- Train in the cab, not in the office, during a low-stakes operation
- Never accept parallel paper records as a fallback past week three; two systems means neither is trusted
Transformation 4: Yield Correlation and Multi-Year Field Performance
Single-season yield maps are interesting. Five-season normalized yield trends by management zone are actionable.
Building a Usable Yield History
The technical prerequisites are more demanding than vendors suggest:
Calibrated yield monitor data. Uncalibrated combine data can be off 5–15% and will drift within a season as moisture and crop conditions change. Calibrate at the start of each crop and after any significant condition change. Software cannot fix uncalibrated data, though better platforms will flag statistical outliers and pass/flow inconsistencies.
Consistent field boundaries across years. If a field was split in 2023 and merged in 2025, your trend analysis breaks unless the platform handles boundary versioning properly. Ask about this specifically during evaluation.
Normalization. Raw yield across years isn’t comparable — 2023 and 2024 had different weather. Useful platforms normalize each year’s yield to that year’s field or farm mean, producing a relative productivity index. A zone that runs 0.85 of field average for four consecutive years is telling you something structural.
What to Do With the Analysis
The decisions that yield history actually supports:
- Variable-rate seeding zones. Consistently high-productivity zones justify higher populations; consistently low zones often respond better to lower populations and reduced input intensity.
- Drainage capital allocation. Multi-year low-performing zones that correlate with topographic wetness are the highest-return tile projects on the farm. Ranking these by acre-weighted yield gap makes capital committee conversations short.
- Cash rent decisions. A field running 88% of your farm average for five years, at 105% of your average rent, is a renegotiation or a walk-away.
- Enterprise switching. Some acres are simply better in a different crop or in a conservation program. Multi-year data makes that case defensible to landlords.
Setting Expectations on Timeline
You will not get meaningful yield trend analysis in year one. Three seasons of clean data is the practical minimum for zone-level confidence; five is better. This is the strongest argument for starting data capture now even if you’re not ready to act on it — the analysis clock doesn’t start until the data does.
Transformation 5: Integrated Financial and Agronomic Decision-Making
The endpoint of a mature implementation is a single question answerable in under a minute: what is my breakeven on this field, and what does the current market let me do about it?
Connecting the Layers
The data chain: field boundaries → input applications with costs → labor and machine hours with costs → allocated overhead → yield → contracted and spot pricing → margin per acre and per bushel.
Most crop management platforms deliver the left half of that chain well and the right half poorly. Integration with accounting — QuickBooks, Xero, or a purpose-built ag accounting system — is where the chain either closes or breaks. Evaluate this integration with actual test data before purchase, not from a feature checklist.
Marketing Decisions With Real Cost Basis
An operator who knows their loaded cost of production is $4.42/bu on 1,800 acres of corn makes categorically different marketing decisions than one working from a rough $4.00–$4.75 range. The precision changes behavior at the margins: whether to price the next 20,000 bushels, whether a basis contract makes sense, whether to store or move at harvest.
Scenario Modeling
The more advanced platforms support pre-season scenario comparison: what happens to whole-farm margin if fertilizer moves 15%, if corn acres shift 200 acres to soybeans, if you drop a fungicide pass. These models are only as good as their cost inputs, which is why transformation 1 is a prerequisite for transformation 5.
Selection and Implementation Checklist
Work this sequentially. Skipping steps is how farms end up with three overlapping subscriptions and no single source of truth.
Phase 1: Requirements Definition (2–3 weeks, before contacting vendors)
- Document your current record-keeping workflow, including who does what and where data lives
- List every compliance requirement and market-channel documentation obligation you face
- Identify all equipment brands and model years that will need to push or pull data
- List existing software you will not replace (accounting, payroll, grain marketing)
- Define your three most painful current problems in one sentence each
- Set a realistic annual budget — see cost benchmarks below
- Name a single internal owner for the implementation with authority to enforce process
Phase 2: Vendor Evaluation (3–5 weeks)
- Shortlist no more than four platforms
- Require a demo using your field boundaries and your actual data, not the vendor’s sample farm
- Test the mobile app in low-connectivity conditions — offline capture and sync is non-negotiable
- Verify machine data import from your specific equipment, with a real file
- Test the accounting integration with a live sandbox connection
- Ask directly: what does data export look like if we leave? Get the answer in writing
- Confirm who owns your agronomic data and what secondary use rights the vendor claims
- Contact two references operating at your scale and in your crop mix
- Clarify support model — hours, response times, whether there’s a named implementation contact
- Understand pricing structure: per-acre, per-user, tiered, or flat, and what triggers a tier change
Phase 3: Implementation (6–12 weeks, ideally in the off-season)
- Clean and verify all field boundaries against current reality, not FSA maps
- Import a minimum of three prior years of records if available
- Load product catalog with current costs and label PHI/REI data
- Configure user roles and permissions — operators should not be able to delete records
- Build your five most common task templates
- Train managers first, then operators, in the cab
- Run a parallel period of no more than three weeks
- Set a hard cutover date and communicate it
- Schedule a 60-day review to fix workflow friction before the season starts
Phase 4: First-Season Discipline
- Weekly 15-minute data completeness check during peak season
- Monthly invoice-to-application reconciliation
- Post-harvest data audit before yield analysis
- Document every workaround people invented, and fix the underlying cause
Cost Benchmarks: What to Budget
Pricing varies widely and vendors rarely publish. Ranges reported by operators as of the 2025 buying cycle:
Field record-keeping platforms: $1–$4 per acre annually, often with volume breaks above 2,000 acres. Some equipment-manufacturer platforms are bundled or near-free with hardware, with the tradeoff being data portability.
Farm business management systems: $3–$8 per acre annually, or $4,000–$25,000+ flat depending on scale and modules.
Compliance-specific modules: $1,500–$8,000 annually as an add-on, driven by certification scheme complexity.
Implementation and data migration: $2,000–$15,000 one-time. Some vendors include it; treat “free implementation” skeptically and ask what hours are actually allocated.
Internal labor cost, first year: This is the number nobody budgets. Expect 80–200 hours of internal time across boundary cleanup, data entry, training, and process redesign. At a $30/hour loaded rate for an operations manager, that’s $2,400–$6,000 of real cost.
Total first-year cost for a 1,500-acre operation implementing a combined record-keeping and business management platform: realistically $8,000–$20,000 all-in. Ongoing years drop to the subscription plus maintenance time.
Against that, the recoverable value: input optimization on marginal acres, compliance premium access, labor coordination savings, and marketing precision. Operations that implement with discipline generally identify enough in year one to cover the cost. Operations that implement without process discipline get an expensive digital filing cabinet.
The 2026 Pressure Points Worth Planning For
Several forces are converging that make deferring this decision more expensive than it used to be.
Verified-practice premiums are becoming verification-first. Buyers in low-carbon-intensity fuel supply chains and sustainability-linked grain programs increasingly require third-party-verifiable field-level records with multi-year history. Farms without three years of structured data are structurally locked out until they build it.
Retroactive documentation is not accepted. Nearly every verification protocol requires contemporaneous records. You cannot reconstruct 2024 in 2026 and pass an audit.
Equipment data is becoming the default input. Newer machines generate substantially more usable data than they did five years ago. Operations without a platform to receive it are leaving that asset idle.
Labor scarcity raises the value of coordination. Fewer experienced operators means less institutional knowledge in the cab and more dependence on explicit instruction. Systems that carry the instruction reduce dependence on the person.
For more on operational systems and technology decisions, browse the software and farm management categories. If you’re working through equipment data integration specifically, the precision agriculture section covers the machine side in more depth. Compliance-heavy operations should also review the regulations and compliance resources.
How FarmsFlo Helps
FarmsFlo was built around the specific problem described at the top of this article: farms that do the work correctly but can’t produce the record. The platform handles field-level activity logging, work order assignment and completion tracking, input and cost capture, and compliance-ready reporting from a single record — so the data you enter once serves your agronomy, your accounting, and your auditor.
Practical specifics that matter to operators evaluating options:
- Offline-first mobile capture. Operators log applications, scouting notes, and task completions without connectivity, with automatic sync when coverage returns.
- Configurable required fields. Set the minimum data set your operation actually needs, including wind, temperature, and applicator certification for spray records, without forcing eleven fields on a busy operator.
- Multi-year field performance views with boundary versioning that survives field splits and merges.
- Cost roll-up by field, farm, landlord, and enterprise for real per-bushel cost of production.
- Full data export, because your agronomic history is your asset, not ours.
You can start a free trial at farmsflo.com and load your own field boundaries — not a demo farm — to see how your actual operation looks in the system before committing to anything. Import a prior season of records, run a work order through to completion, and pull a compliance report. That’s a two-hour evaluation that will tell you more than any sales call.
The operations that will be positioned for verified-practice markets in 2026 are the ones capturing clean data in 2025. The clock on your data history starts the day you begin.